
Transportation 2025 Year Review: Bankruptcies, Acquisitions, Mergers, and Closures

Share this Article:
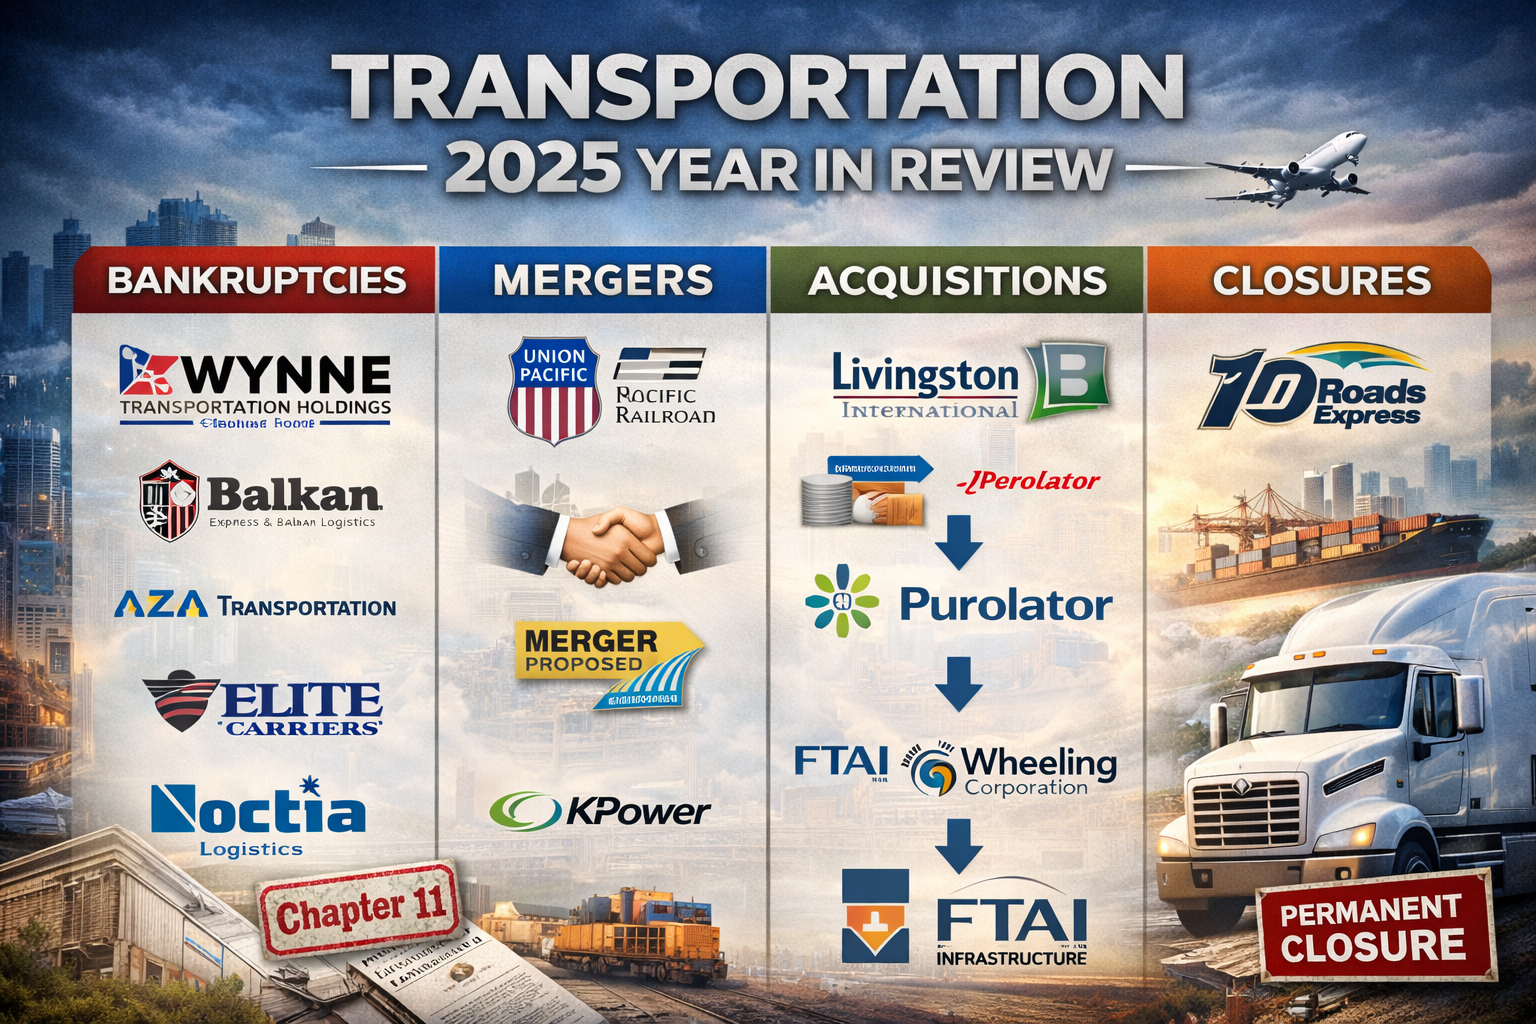
The transportation industry exited 2025 fundamentally reshaped. What began as a prolonged freight recession evolved into a structural reset driven by sustained margin pressure, tightening capital, regulatory complexity, and heightened scrutiny of compliance and operating discipline. Bankruptcies rose sharply, voluntary closures accelerated, and consolidation activity reached levels not seen since prior downcycles.


For Transportation Tax Consulting (TTC) and its clients, 2025 reinforced a central truth: financial survival and transaction success increasingly depend on tax strategy, compliance execution, and operational visibility—not just freight volumes.


Bankruptcies Accelerated as Structural Costs Outpaced Revenue

Carrier bankruptcies climbed again in 2025 after already elevated filings in 2023 and 2024. Industry estimates and court filings indicate that U.S. trucking bankruptcies in 2025 increased by more than 35% year over year, driven primarily by small and mid-sized fleets.


Key drivers included:

  • Spot market exposure: Spot rates remained 20–30% below 2021 peaks for much of the year
  • Insurance inflation: Premiums rose another 10–15% for many carriers
  • Equipment replacement pressure: Emissions-compliant equipment increased capital requirements
  • Tax and compliance exposure: Multistate fuel tax, sales/use tax, and employment classification issues surfaced during audits and distressed transactions


The bankruptcy trend chart above illustrates the steady rise in carrier failures since 2021, culminating in 2025 as financially weakened operators ran out of options.


From TTC’s perspective, many bankruptcies revealed unaddressed tax liabilities—including unpaid fuel taxes, misapplied sales tax exemptions, and unremitted payroll taxes—that significantly reduced recovery value and complicated restructurings.


Closures Reflected Strategic Exits, Not Just Failure

Beyond formal bankruptcies, thousands of carriers voluntarily exited the market in 2025. Owner-operators and family-owned fleets increasingly chose to shut down operations rather than refinance debt, absorb compliance costs, or invest in new technology.


Common closure drivers included:

  • Aging ownership with no succession plan
  • Rising administrative burden tied to tax filings, registrations, and audits
  • Difficulty maintaining compliance across multiple jurisdictions
  • Limited access to affordable insurance and credit


Brokerages and small logistics providers also closed quietly as digital platforms and large intermediaries consolidated shipper relationships.


For TTC clients, these closures often triggered unexpected exposure, including:

  • Orphaned fuel tax accounts
  • Unresolved audit notices
  • Asset disposition sales tax issues
  • Nexus questions following market exits


Closures reinforced the importance of exit planning, even for companies not pursuing bankruptcy or sale.


Mergers Increased as Scale Became a Risk-Management Tool

Mergers gained momentum in 2025 as carriers sought density, efficiency, and purchasing power. Unlike prior cycles focused on rapid geographic expansion, most mergers emphasized:

  • Terminal consolidation
  • Lane density optimization
  • Overhead reduction
  • Back-office centralization


Private equity-backed platforms led much of this activity, targeting compliance-ready operators with clean tax profiles and documented processes.


The M&A activity chart above illustrates the steady increase in transportation transactions through 2025, reflecting both defensive and opportunistic consolidation.


TTC observed a clear trend: buyers increasingly demanded tax diligence early in the process. Transactions stalled—or valuations adjusted—when targets lacked clean fuel tax filings, sales tax documentation, or employment tax compliance.


Acquisitions Became More Disciplined and Asset-Focused

Acquisitions in 2025 shifted toward selective, strategic deals rather than full-platform rollups. Buyers focused on:


  • Asset purchases out of bankruptcy
  • Specialized fleets (temperature-controlled, bulk, dedicated)
  • Contract-heavy operators with predictable revenue


Asset-only acquisitions allowed buyers to avoid assuming historical tax and compliance liabilities, a strategy TTC frequently supported through transaction structuring and liability isolation.


Technology-driven acquisitions also expanded, particularly in logistics software and compliance automation. These deals aimed to reduce long-term administrative risk while improving reporting accuracy.


Shipper Behavior Accelerated Consolidation Pressure

Shippers played a direct role in reshaping the market. In 2025:


  • Large shippers reduced carrier counts by an estimated 15–25%
  • Contract rebids emphasized compliance, reporting, and audit readiness
  • Dedicated and hybrid fleet models gained share


Carriers unable to demonstrate fuel tax accuracy, emissions compliance, and regulatory consistency increasingly lost freight—even when rates were competitive.


For TTC, this trend underscored the growing link between tax compliance and revenue retention.


Regulatory and Tax Complexity Influenced Winners and Losers

Regulatory pressure intensified throughout 2025. State revenue agencies increased audit activity, particularly around:


  • Fuel tax reporting
  • Sales and use tax on equipment, parts, and leases
  • Worker classification and payroll tax compliance


Carriers entering mergers, acquisitions, or restructurings faced heightened scrutiny of historical filings.

TTC frequently supported clients by:

  • Quantifying historical exposure
  • Resolving legacy liabilities pre-transaction
  • Structuring deals to mitigate successor liability
  • Supporting post-merger integration of tax processes


Companies that invested in compliance infrastructure earlier in the cycle emerged as preferred acquisition targets.


Workforce Disruption and Realignment

Industry restructuring displaced thousands of drivers and staff. While consolidation absorbed some talent, uncertainty persisted in regions heavily affected by closures.


However, acquiring firms that executed clean integrations—including payroll tax alignment and benefit compliance—retained talent more effectively and avoided post-close disruptions.


TTC Perspective: 2025 Was a Compliance Wake-Up Call

From Transportation Tax Consulting’s vantage point, 2025 clearly demonstrated that:


  • Tax exposure materially impacts valuation
  • Compliance failures accelerate distress
  • Clean filings enable faster, more favorable transactions
  • Proactive advisory reduces downside risk


Bankruptcies, mergers, acquisitions, and closures were not isolated financial events—they were compliance stress tests.


Looking Ahead: Discipline Defines the Next Cycle

The transportation industry enters 2026 leaner, more consolidated, and more disciplined. Capacity rationalization improved long-term fundamentals, but success will favor companies that:


  • Maintain strong compliance frameworks
  • Integrate tax strategy into growth planning
  • Prepare early for transactions and exits
  • Treat tax and regulatory management as strategic assets


The turbulence of 2025 cleared excess capacity—but it also elevated the role of advisors who understand transportation’s unique tax and compliance landscape.


Share with Us:

By Matthew Bowles June 8, 2026
A restructuring project lives or dies on a single question: does the new structure actually lower your tax — in every state you touch — without creating new exposure somewhere else? Answering that takes two things most firms don't pair together: deep transportation tax expertise and a disciplined project method. Transportation Tax Consulting brings both. We build the project around your footprint, not a template We start by mapping how your business is taxed today — federally and across all 51 jurisdictions where your equipment, mileage, and people create obligations. That diagnostic is where the real opportunities surface, and it's the step generalist firms skip when they reach for an off-the-shelf structure that wasn't designed for a motor carrier. We pull the levers that are specific to transportation The savings in a transportation restructure come from levers other advisors don't see: separating operating, asset-holding, and equipment-leasing entities; situating them where they reduce sales and use tax, property tax, and income and franchise tax; structuring intercompany leasing; and accounting for mileage-based apportionment, rolling stock exemptions, nexus, and the interplay of FET, IFTA, and IRP. We design the structure around how transportation is actually taxed, not how a typical business is. We model the savings before you spend a dollar restructuring Before you commit to anything, we quantify the projected effective-rate reduction and stress-test it against alternative structures. You see the numbers — state by state, scenario by scenario — including any new apportionment or nexus exposure a given option would create. The decision to proceed is driven by a model, not a hunch, and you know what the project is worth before you fund it. We quarterback execution alongside your counsel We lead the tax design and run the project end to end. The legal mechanics — forming entities and drafting agreements — sit with your attorneys, and we work in lockstep with them so the executed structure delivers the tax result it was engineered to produce. You get a single team driving the engagement, not a pile of disconnected advice. We make the result defensible and audit-ready Minimizing tax only matters if the position holds up. Every element of the structure is supported by primary-source analysis and contemporaneous documentation, built to withstand state examination and to answer, clearly, how and why the structure was put in place. We stay with you after close A structure is only as good as the compliance that follows it. We carry the project through to ongoing multistate filing and monitoring — and because we're already inside your tax data, we continue surfacing recovery opportunities and structural refinements long after the restructure is complete. The result: a measurably lower multistate tax burden, delivered by a structure that was diagnosed, modeled, executed, and defended by a team that does nothing but transportation tax.
By Matthew Bowles May 14, 2026
In trucking, everyone talks about rates per mile. But surprisingly few transportation professionals truly understand the hidden forces shaping those numbers. Cost per mile (CPM) is more than a spreadsheet formula — it’s the heartbeat of profitability, fleet survival, driver retention, and long-term strategy. The most successful transportation companies are not always the ones hauling the most freight. Often, they are simply the ones that understand their cost structure better than everyone else. Here are some of the most overlooked — and surprisingly fascinating — facts about transportation cost per mile. 1. One Extra MPH Can Cost Thousands Per Truck Per Year Most drivers and managers underestimate how dramatically speed impacts fuel economy. A truck running 70 MPH instead of 65 MPH may only arrive minutes earlier, but fuel efficiency can drop by 0.5 to 1 MPG depending on terrain and equipment. For a truck running 120,000 miles annually: A 1 MPG loss can increase fuel cost by over $8,000 annually per truck Across a 100-truck fleet, that can exceed $800,000 yearly The shocking part? Many fleets focus harder on rate negotiation than speed management, even though speed discipline can create larger margin improvements. 2. Empty Miles Hurt More Than Most Fleets Realize Deadhead miles are often treated as “part of trucking,” but many strategic planners fail to measure their true impact. An empty mile still creates: Fuel expense Tire wear Maintenance Driver wages Depreciation Insurance exposure A truck with a $2.00 loaded CPM may actually require $2.45+ revenue CPM when deadhead is included. The industry’s biggest hidden leak is not fuel. It’s unproductive miles. 3. Tires Cost More Per Mile Than Many Office Departments A typical long-haul tractor-trailer can burn through: 18 tires Multiple replacements yearly Thousands in alignment and wear-related issues Tires alone often account for: 3–5 cents per mile That sounds small until you realize: 5 cents × 120,000 miles = $6,000 annually per truck Poor inflation management can reduce tire life by 20% or more. Many fleets obsess over diesel prices while ignoring one of their most controllable expenses sitting literally on the ground. 4. Driver Turnover Quietly Raises Cost Per Mile Everywhere Most people think turnover only affects recruiting costs. In reality, turnover raises: Accident frequency Idle time Fuel usage Maintenance issues Insurance claims Late deliveries Customer churn A new driver often operates less efficiently than an experienced one familiar with routes, customers, and company procedures. Some analysts estimate high-turnover fleets unknowingly add: 10–20 cents per mile in indirect operational costs That can erase profitability faster than a soft freight market. 5. The Cheapest Truck Is Not Always the Most Profitable Truck Many fleets buy equipment based on purchase price instead of lifecycle CPM. A cheaper truck may: Break down more frequently Lose fuel efficiency sooner Create higher downtime costs Have lower resale value An expensive truck with better fuel economy and uptime may actually produce a lower total CPM over five years. Strategic fleets calculate: Total operating cost Residual value Maintenance curves Downtime probability Not just monthly payments. 6. Idle Time Is One of the Industry’s Most Expensive Invisible Costs A truck parked at a dock still burns money. Even when wheels are not turning: Insurance continues Driver hours are consumed Equipment depreciates Financing accrues Opportunity cost increases Some studies estimate detention-related inefficiencies can cost fleets: Tens of thousands annually per truck The most profitable fleets are often not the fastest fleets — they are the fleets with the least wasted time. 7. Fuel Surcharges Rarely Cover Actual Fuel Costs Perfectly Many shippers assume fuel surcharges completely offset fuel volatility. They usually do not. Why? Because surcharge formulas often: Lag market changes Ignore idle fuel burn Exclude reefer fuel Fail to account for out-of-route miles Use outdated baseline assumptions When diesel spikes quickly, carriers often absorb major temporary losses before surcharge programs catch up. 8. Maintenance Costs Rise Exponentially — Not Gradually A common misconception is that maintenance increases steadily over time. In reality, maintenance costs often rise like a curve. After certain mileage thresholds: Repairs become more frequent Downtime accelerates Parts failures multiply That is why some fleets trade equipment aggressively while others run equipment longer based on maintenance analytics. The smartest fleets know exactly when each truck stops being profitable. 9. Cost Per Mile Changes by Freight Type More Than Most Think Two trucks may drive identical routes but produce completely different CPMs depending on freight. Examples: Refrigerated freight increases fuel burn Heavy haul accelerates tire wear Hazmat increases insurance exposure Multi-stop freight destroys productivity Urban deliveries increase braking and idle time Many transportation professionals benchmark CPM too broadly without segmenting operations correctly. 10. The Most Dangerous Number in Trucking Is “Average CPM” Average CPM hides operational truth. One lane may be highly profitable while another silently destroys margins. One driver may average: 7.8 MPG Another: 5.9 MPG One customer may create: 30-minute turns Another: 4-hour detention delays Averages conceal inefficiency. Elite transportation strategists analyze CPM: By lane By customer By driver By trailer type By terminal By season That level of visibility separates surviving fleets from elite fleets. Final Thought Transportation cost per mile is not just an accounting metric. It is a strategic intelligence system. The fleets that dominate the future of transportation will not simply move more freight — they will understand their cost structure with greater precision than their competitors. In trucking, pennies per mile decide: profitability, expansion, acquisitions, bankruptcies, and survival. And most of those pennies are hiding in places the industry still overlooks.
Business meeting in a glass office, with a man speaking to two colleagues across a table.
May 5, 2026
Understand economic vs physical nexus, how each triggers sales tax obligations, and strategies transportation companies can use to manage multi-state compliance.