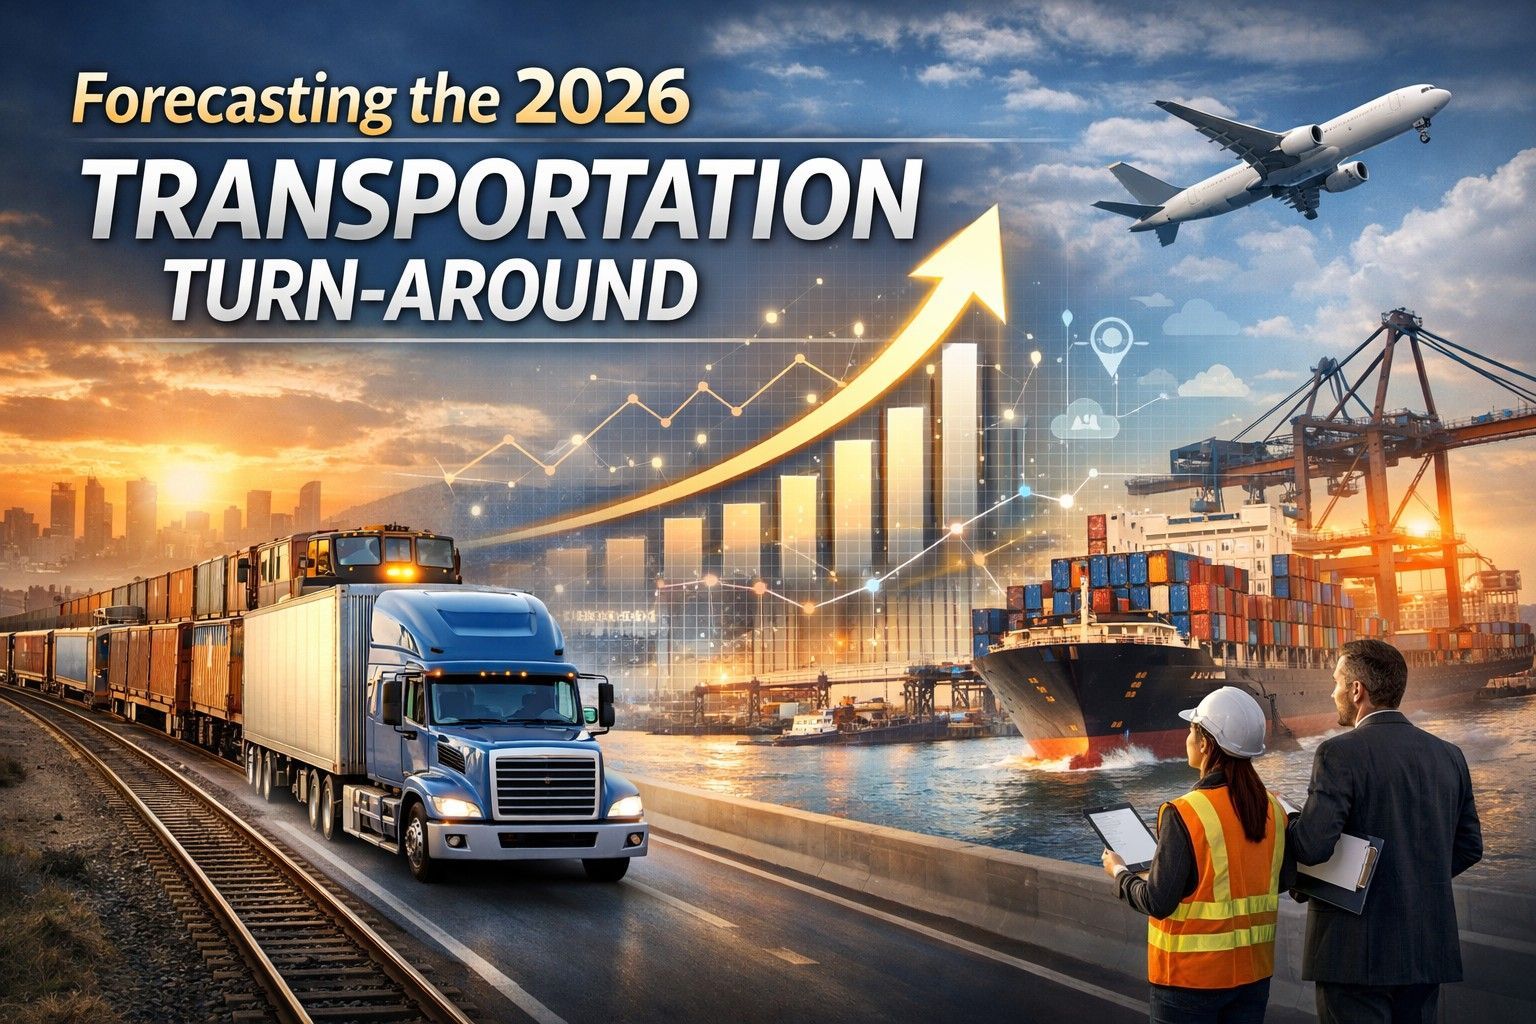
Forecasting the 2026 Transportation Turn-Around
Share this Article:
The North American transportation industry enters 2026 carrying the scars of a prolonged freight downturn—but also the structural changes needed for recovery. After years of excess capacity, margin compression, and muted demand, the sector now shows clear signs of recalibration. Carriers have reduced fleets, shippers have adjusted sourcing strategies, and regulators continue to reshape compliance expectations. These forces converge in 2026, positioning the transportation industry for a measured but meaningful turn-around.
This recovery will not resemble past freight booms. Instead, it will reward disciplined operators, data-driven decision-making, and companies that have restructured their cost bases during the downturn. The transportation companies that survive 2024 and 2025 emerge leaner, more technologically enabled, and better aligned with shipper expectations.
Capacity Discipline Resets the Market
The freight downturn forced capacity out of the system. Smaller carriers exited the market, owner-operators parked trucks, and larger fleets delayed equipment purchases. This contraction laid the groundwork for stabilization. By early 2026, the imbalance between supply and demand narrows substantially.
Truckload capacity tightens first. Fleet bankruptcies and consolidations reduce overcapacity that plagued the market since 2022. Railroads, having already optimized precision scheduled railroading models, benefit from improved network fluidity and intermodal growth. Even last-mile and regional carriers experience steadier volumes as e-commerce normalizes at sustainable growth rates.
Carriers that remain in operation in 2026 operate fewer assets but deploy them more efficiently. This discipline supports gradual rate improvement without triggering inflationary spikes. Shippers gain predictability, while carriers regain pricing power grounded in service reliability rather than desperation.
Demand Stabilizes and Broadens
Freight demand does not surge overnight, but it stabilizes across multiple sectors in 2026. Manufacturing reshoring and near-shoring initiatives continue to generate freight tied to domestic production rather than volatile overseas imports. Automotive, energy, and industrial materials lead early volume gains.
Consumer spending shifts away from discretionary goods toward durable and essential products. This shift favors freight lanes tied to construction materials, food distribution, and industrial inputs. Retail replenishment cycles shorten, creating steadier, more predictable freight flows.
Importantly, shippers move away from panic-driven overordering. Inventory strategies improve as companies integrate better forecasting tools and supply chain visibility. This change reduces extreme demand swings that previously destabilized carrier networks.
Intermodal and Rail Gain Strategic Ground
Rail and intermodal transportation play a central role in the 2026 recovery. Rising driver costs, environmental pressures, and congestion concerns push shippers to reconsider long-haul truckload dependence. Intermodal offers cost stability and emissions advantages that resonate with corporate sustainability goals.
Railroads continue investing in terminal automation, crew optimization, and service consistency. These investments pay dividends as volume returns. Intermodal lanes expand beyond traditional coastal corridors, serving interior manufacturing hubs and distribution centers.
For trucking companies, intermodal does not represent competition—it represents partnership. Drayage providers, regional carriers, and integrated logistics firms find new opportunities supporting rail growth. Companies that align truck and rail strategies position themselves for diversified revenue streams.
Technology Separates Winners from Survivors
The downturn forces transportation companies to confront inefficiencies they once ignored. By 2026, technology adoption moves from optional to essential. Carriers leverage telematics, route optimization, predictive maintenance, and real-time visibility to protect margins.
Artificial intelligence and advanced analytics reshape pricing, network planning, and fuel management. Companies that invested early use data to anticipate demand shifts rather than react to them. Shippers reward these carriers with longer-term contracts and collaborative planning relationships.
Back-office systems also mature. Automated billing, tax compliance tools, and audit-ready reporting reduce administrative burden. These improvements allow management teams to focus on growth rather than survival.
Labor Pressures Ease but Do Not Disappear
Driver availability improves modestly in 2026, but labor remains a structural challenge. Carriers benefit from reduced turnover as fewer competitors chase the same drivers. Improved scheduling, regional routes, and home-time predictability become retention tools rather than perks.
Wage inflation moderates, but benefit costs and compliance obligations continue to rise. Companies that invested in driver engagement, safety programs, and technology-enabled workflows retain talent more effectively. Those that rely solely on pay increases struggle to compete.
Management labor also tightens. Skilled dispatchers, safety professionals, and compliance specialists command premium compensation. Firms that train internally and build career pathways gain an advantage.
Regulatory Complexity Shapes Strategic Planning
Regulation does not slow in 2026. Instead, it becomes more targeted and data-driven. Environmental reporting, fuel tax compliance, and cross-jurisdictional audit activity increase. Governments leverage improved data systems to identify under-reporting and misclassification.
Carriers and shippers respond by integrating compliance into strategic planning rather than treating it as a reactive function. Tax strategy, entity structuring, and transaction analysis become board-level discussions.
Transportation companies that proactively address fuel tax exposure, sales and use tax risks, and multistate compliance protect margins during the recovery. Those that ignore these issues face audits that erase hard-earned gains.
Mergers and Acquisitions Accelerate
The recovery phase invites consolidation. Strong balance sheets, improved cash flow, and normalized valuations drive merger and acquisition activity in 2026. Strategic buyers pursue regional density, specialized equipment, and technology capabilities rather than raw scale.
Private equity re-enters the market selectively. Investors favor companies with disciplined growth strategies, compliance maturity, and diversified customer bases. Transactions emphasize operational integration rather than financial engineering.
For smaller carriers, acquisition offers an exit strategy after years of volatility. For larger platforms, consolidation strengthens negotiating power with shippers and vendors while spreading fixed costs across broader networks.
Shippers Redefine Partnerships
Shippers approach 2026 with lessons learned from supply chain disruption. They prioritize reliability, transparency, and collaboration over transactional rate shopping. Procurement teams shift from quarterly bids to multi-year partnerships tied to performance metrics.
Transportation providers that demonstrate operational discipline and compliance credibility earn preferred-carrier status. These relationships support steady volume commitments that benefit both parties.
Shippers also invest in internal transportation expertise. They understand tax exposure, regulatory risk, and modal strategy more deeply. This sophistication raises expectations for carriers but also creates opportunities for value-added services.
Financial Health Improves Gradually
The 2026 turn-around does not restore peak profitability immediately. Instead, margins improve incrementally as cost structures normalize and pricing stabilizes. Fuel price volatility remains a risk, but hedging strategies and surcharge mechanisms improve.
Cash flow strengthens as bankruptcy risk declines and payment cycles stabilize. Lenders regain confidence, enabling refinancing and selective capital investment. Equipment purchases resume cautiously, favoring fuel-efficient and technology-enabled assets.
Carriers that survived the downturn with disciplined balance sheets gain flexibility to invest in growth without overleveraging.
A Different Kind of Recovery
The transportation industry’s 2026 recovery reflects evolution rather than expansion. Companies succeed by applying lessons learned from adversity. They value data over intuition, discipline over speed, and partnerships over transactions.
This turn-around favors organizations that invested during the downturn—whether in technology, compliance, people, or process improvement. The market rewards preparedness, not speculation.
While uncertainty remains, the direction is clear. Capacity aligns with demand. Shippers stabilize volumes. Technology enhances execution. Regulation rewards transparency. Together, these forces create a foundation for sustainable growth.
Conclusion: Preparing for the Turn-Around
The 2026 transportation turn-around will not lift all participants equally. It will elevate companies that acted decisively during the downturn and challenge those that waited for conditions to improve on their own.
Transportation leaders who plan now—by strengthening compliance, refining networks, investing in technology, and deepening shipper relationships—position their organizations to lead the next cycle. The recovery will arrive quietly, but its impact will be lasting for those ready to seize it.
The question is no longer whether the transportation industry will turn around. The question is which companies will emerge stronger when it does.
Share with Us: