The Hidden Tax Cost of Trucking: The 15¢ Per Mile Nobody Talks About

Share this Article:
Most people think the biggest cost in trucking is fuel.


Others say it’s drivers.


Some point to insurance, equipment payments, or maintenance.

But one of the largest costs in trucking is rarely discussed at all.

Taxes.


Not income taxes. Not payroll taxes.


Transportation taxes.

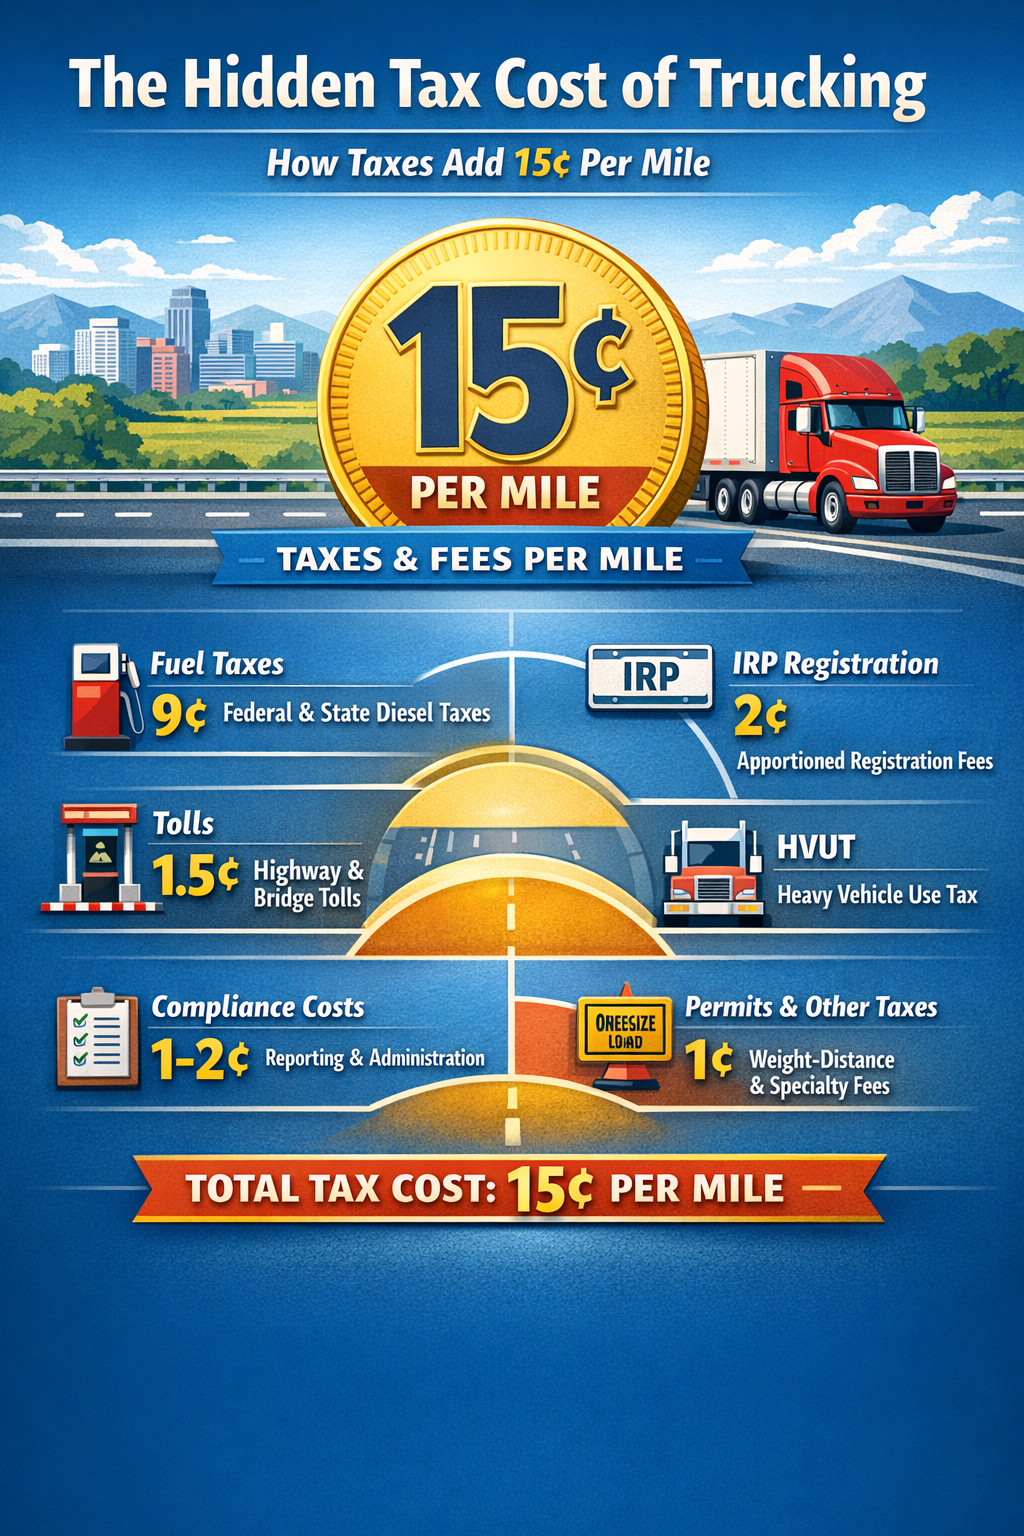
And when you add them together, they can quietly add about 15 cents to every mile a truck drives.

For a truck running 100,000 miles a year, that’s $15,000 annually in taxes and regulatory fees.

For a fleet of 500 trucks, that’s $7.5 million per year.


Yet most people — including many policymakers — have little understanding of how these taxes actually work.

Let’s break it down.


The Most Taxed Vehicle on the Road

A heavy-duty truck operating in interstate commerce sits inside one of the most complex tax systems in North America.


Carriers don’t just pay one transportation tax.


They pay many of them simultaneously.


Depending on where and how a truck operates, taxes may be tied to:


 • Fuel consumption
• Miles traveled
• Vehicle weight
• State registrations
• Toll road usage
• Interstate operations


Each tax exists for a reason.

Most fund transportation infrastructure like highways and bridges.

But when layered together, they create a system that most people outside trucking never see.


Start With Diesel Fuel Taxes

The largest trucking tax is hidden in plain sight: diesel fuel taxes.


Every gallon of diesel purchased in the United States includes both federal and state taxes.

The federal diesel tax is:


24.3 cents per gallon

States then add their own fuel taxes, which vary widely.


Across the country, state diesel taxes typically range from 20 cents to more than 70 cents per gallon.

When federal and state taxes are combined, diesel fuel taxes often total 55–65 cents per gallon.

Now consider the math.


A typical Class 8 truck averages roughly 6.5 miles per gallon.


If taxes total 60 cents per gallon:


That’s roughly 9 cents in tax for every mile the truck drives.

Just from fuel.


More than half of the total tax burden is literally burned through the engine one mile at a time.


Then Comes Interstate Fuel Reporting

Once a truck crosses state lines, fuel taxes become more complicated.

A truck may purchase fuel in one state but drive thousands of miles in others.


Every state expects to receive its share of the tax revenue.


To manage this, interstate carriers operate under something called the International Fuel Tax Agreement (IFTA).

Under IFTA, fleets must track:


 • Every mile driven in every state
• Every gallon of fuel purchased
• Total fuel consumption


Carriers then file quarterly fuel tax reports showing how much tax each jurisdiction is owed.

IFTA simplified a previously chaotic system — but it also created a compliance machine.


Fleets must invest in:


 • Mileage tracking systems
• Electronic logging devices
• Accounting software
• Administrative staff
• Audit documentation


The cost of managing this reporting infrastructure adds another 1–2 cents per mile to operations.

Taxes are not just paid with money.


They’re paid with time, technology, and administrative complexity.


The Heavy Vehicle Use Tax

Heavy trucks also pay a federal tax simply for operating on public highways.


It’s called the Heavy Vehicle Use Tax (HVUT).


Any truck weighing 55,000 pounds or more must pay this tax annually.


For most trucks, the amount is $550 per year per vehicle.


That may not sound like much compared to fuel taxes.


But spread across 100,000 miles per year, it still adds roughly:


Half a cent per mile.


Even small taxes matter when every mile counts.


Interstate Registration Fees

Next comes vehicle registration.


Most vehicles register in a single state.


Trucks are different.


Because they operate across multiple states, interstate carriers must register under the International Registration Plan (IRP).


IRP spreads registration fees across states based on where trucks actually drive.

Instead of registering in one place, carriers essentially register everywhere they operate.


Annual IRP registration fees for heavy trucks commonly range between:


$1,500 and $3,000 per truck.


Spread across annual mileage, that adds another 2–3 cents per mile.


Now Add Tolls

In some parts of the country, tolls are a major operational expense.


Major trucking corridors like:


 • The Pennsylvania Turnpike
• The New York Thruway
• The Ohio Turnpike
 • The New Jersey Turnpike


charge significantly higher toll rates for heavy trucks.


In many cases, a truck crossing one of these corridors can pay over $100 in tolls for a single trip.

Across national operations, tolls often add 1–2 cents per mile.


For fleets operating heavily in toll states, it can be even more.


Weight-Distance Taxes

Some states go a step further.


Instead of taxing fuel or registration, they tax trucks directly based on miles traveled and vehicle weight.

States like:


 • Oregon
• Kentucky
• New Mexico
• New York


operate weight-distance tax systems.


These taxes exist because heavy vehicles create more wear on road infrastructure.

Depending on routes, these taxes can add another 1–3 cents per mile.


The 15¢ Per Mile Reality

When you combine all of these layers, the total tax burden becomes clear.


A typical breakdown might look like this:


Fuel taxes: ~9¢ per mile


IRP registration: ~2¢ per mile


Tolls: ~1.5¢ per mile


HVUT: ~0.5¢ per mile


Compliance costs: ~1–2¢ per mile


Weight-distance taxes and permits: ~1¢ per mile


Total:


Approximately 15 cents per mile.


Again, that’s $15,000 per truck per year for a vehicle running 100,000 miles.

For large fleets, taxes quickly become one of the largest operating costs in the business.


Why This Matters to the Economy


Trucking moves roughly 70% of domestic freight in the United States.


That means nearly everything we buy — food, clothing, electronics, construction materials — travels by truck at some point.


Transportation taxes therefore don’t just affect trucking companies.


They influence the entire supply chain.


Every additional cost in trucking eventually appears somewhere else:


 • Higher freight rates
• Increased shipping costs
• Higher prices for goods


In other words:


Transportation taxes quietly contribute to inflation across the economy.


The Thin Margin Problem

One reason these taxes matter so much is because trucking operates on very thin margins.


Typical net profit margins for trucking companies are often:


3–6%.


When margins are that tight, even small cost changes matter.


Carriers usually cannot absorb major tax increases.


Instead, the costs eventually flow through to:


 • Freight contracts
• Fuel surcharges
• Accessorial fees
• Spot market pricing


Taxes don’t disappear.


They simply move through the system.


Why Most People Don’t See These Costs

One reason trucking taxes remain invisible is that they’re fragmented across dozens of systems.


There’s no single “trucking tax.”


Instead there are:


 • Fuel taxes
• Interstate fuel reporting
• Highway use taxes
• Registration fees
• Tolls
• Weight-distance taxes
• Permits
• Compliance requirements


Each one seems small.


Together, they create a massive cost structure.


The Policy Debate Is Just Beginning

Transportation funding is already becoming a major policy issue.


Fuel taxes historically funded most highway infrastructure.


But as vehicles become more fuel efficient — and electric vehicles become more common — governments are beginning to question whether fuel taxes will remain viable long term.


Some policymakers are exploring alternatives like mileage-based road user fees.


For trucking companies, that could mean an entirely new generation of transportation taxes in the future.


Why Understanding Trucking Taxes Matters

If you want to understand the economics of freight, you have to understand taxes.


They influence:


 • Fleet operating costs
• Freight rates
• Supply chain pricing
• Infrastructure funding
• Transportation policy


For trucking companies, tax management is no longer just an accounting exercise.


It’s a strategic discipline.


One Final Thought

Next time you see a semi-truck traveling down the highway, consider what’s happening behind the scenes.


Every mile that truck travels includes:


Fuel taxes.

Highway taxes.

Registration fees.

Compliance costs.

Tolls.

Infrastructure funding.


By the time that truck reaches its destination, roughly 15 cents of every mile traveled has gone to taxes and regulatory fees.


It’s one of the most important — and least understood — cost structures in the entire transportation economy.


And it’s hiding in plain sight.

Share with Us:

By Matthew Bowles June 8, 2026
A restructuring project lives or dies on a single question: does the new structure actually lower your tax — in every state you touch — without creating new exposure somewhere else? Answering that takes two things most firms don't pair together: deep transportation tax expertise and a disciplined project method. Transportation Tax Consulting brings both. We build the project around your footprint, not a template We start by mapping how your business is taxed today — federally and across all 51 jurisdictions where your equipment, mileage, and people create obligations. That diagnostic is where the real opportunities surface, and it's the step generalist firms skip when they reach for an off-the-shelf structure that wasn't designed for a motor carrier. We pull the levers that are specific to transportation The savings in a transportation restructure come from levers other advisors don't see: separating operating, asset-holding, and equipment-leasing entities; situating them where they reduce sales and use tax, property tax, and income and franchise tax; structuring intercompany leasing; and accounting for mileage-based apportionment, rolling stock exemptions, nexus, and the interplay of FET, IFTA, and IRP. We design the structure around how transportation is actually taxed, not how a typical business is. We model the savings before you spend a dollar restructuring Before you commit to anything, we quantify the projected effective-rate reduction and stress-test it against alternative structures. You see the numbers — state by state, scenario by scenario — including any new apportionment or nexus exposure a given option would create. The decision to proceed is driven by a model, not a hunch, and you know what the project is worth before you fund it. We quarterback execution alongside your counsel We lead the tax design and run the project end to end. The legal mechanics — forming entities and drafting agreements — sit with your attorneys, and we work in lockstep with them so the executed structure delivers the tax result it was engineered to produce. You get a single team driving the engagement, not a pile of disconnected advice. We make the result defensible and audit-ready Minimizing tax only matters if the position holds up. Every element of the structure is supported by primary-source analysis and contemporaneous documentation, built to withstand state examination and to answer, clearly, how and why the structure was put in place. We stay with you after close A structure is only as good as the compliance that follows it. We carry the project through to ongoing multistate filing and monitoring — and because we're already inside your tax data, we continue surfacing recovery opportunities and structural refinements long after the restructure is complete. The result: a measurably lower multistate tax burden, delivered by a structure that was diagnosed, modeled, executed, and defended by a team that does nothing but transportation tax.
By Matthew Bowles May 14, 2026
In trucking, everyone talks about rates per mile. But surprisingly few transportation professionals truly understand the hidden forces shaping those numbers. Cost per mile (CPM) is more than a spreadsheet formula — it’s the heartbeat of profitability, fleet survival, driver retention, and long-term strategy. The most successful transportation companies are not always the ones hauling the most freight. Often, they are simply the ones that understand their cost structure better than everyone else. Here are some of the most overlooked — and surprisingly fascinating — facts about transportation cost per mile. 1. One Extra MPH Can Cost Thousands Per Truck Per Year Most drivers and managers underestimate how dramatically speed impacts fuel economy. A truck running 70 MPH instead of 65 MPH may only arrive minutes earlier, but fuel efficiency can drop by 0.5 to 1 MPG depending on terrain and equipment. For a truck running 120,000 miles annually: A 1 MPG loss can increase fuel cost by over $8,000 annually per truck Across a 100-truck fleet, that can exceed $800,000 yearly The shocking part? Many fleets focus harder on rate negotiation than speed management, even though speed discipline can create larger margin improvements. 2. Empty Miles Hurt More Than Most Fleets Realize Deadhead miles are often treated as “part of trucking,” but many strategic planners fail to measure their true impact. An empty mile still creates: Fuel expense Tire wear Maintenance Driver wages Depreciation Insurance exposure A truck with a $2.00 loaded CPM may actually require $2.45+ revenue CPM when deadhead is included. The industry’s biggest hidden leak is not fuel. It’s unproductive miles. 3. Tires Cost More Per Mile Than Many Office Departments A typical long-haul tractor-trailer can burn through: 18 tires Multiple replacements yearly Thousands in alignment and wear-related issues Tires alone often account for: 3–5 cents per mile That sounds small until you realize: 5 cents × 120,000 miles = $6,000 annually per truck Poor inflation management can reduce tire life by 20% or more. Many fleets obsess over diesel prices while ignoring one of their most controllable expenses sitting literally on the ground. 4. Driver Turnover Quietly Raises Cost Per Mile Everywhere Most people think turnover only affects recruiting costs. In reality, turnover raises: Accident frequency Idle time Fuel usage Maintenance issues Insurance claims Late deliveries Customer churn A new driver often operates less efficiently than an experienced one familiar with routes, customers, and company procedures. Some analysts estimate high-turnover fleets unknowingly add: 10–20 cents per mile in indirect operational costs That can erase profitability faster than a soft freight market. 5. The Cheapest Truck Is Not Always the Most Profitable Truck Many fleets buy equipment based on purchase price instead of lifecycle CPM. A cheaper truck may: Break down more frequently Lose fuel efficiency sooner Create higher downtime costs Have lower resale value An expensive truck with better fuel economy and uptime may actually produce a lower total CPM over five years. Strategic fleets calculate: Total operating cost Residual value Maintenance curves Downtime probability Not just monthly payments. 6. Idle Time Is One of the Industry’s Most Expensive Invisible Costs A truck parked at a dock still burns money. Even when wheels are not turning: Insurance continues Driver hours are consumed Equipment depreciates Financing accrues Opportunity cost increases Some studies estimate detention-related inefficiencies can cost fleets: Tens of thousands annually per truck The most profitable fleets are often not the fastest fleets — they are the fleets with the least wasted time. 7. Fuel Surcharges Rarely Cover Actual Fuel Costs Perfectly Many shippers assume fuel surcharges completely offset fuel volatility. They usually do not. Why? Because surcharge formulas often: Lag market changes Ignore idle fuel burn Exclude reefer fuel Fail to account for out-of-route miles Use outdated baseline assumptions When diesel spikes quickly, carriers often absorb major temporary losses before surcharge programs catch up. 8. Maintenance Costs Rise Exponentially — Not Gradually A common misconception is that maintenance increases steadily over time. In reality, maintenance costs often rise like a curve. After certain mileage thresholds: Repairs become more frequent Downtime accelerates Parts failures multiply That is why some fleets trade equipment aggressively while others run equipment longer based on maintenance analytics. The smartest fleets know exactly when each truck stops being profitable. 9. Cost Per Mile Changes by Freight Type More Than Most Think Two trucks may drive identical routes but produce completely different CPMs depending on freight. Examples: Refrigerated freight increases fuel burn Heavy haul accelerates tire wear Hazmat increases insurance exposure Multi-stop freight destroys productivity Urban deliveries increase braking and idle time Many transportation professionals benchmark CPM too broadly without segmenting operations correctly. 10. The Most Dangerous Number in Trucking Is “Average CPM” Average CPM hides operational truth. One lane may be highly profitable while another silently destroys margins. One driver may average: 7.8 MPG Another: 5.9 MPG One customer may create: 30-minute turns Another: 4-hour detention delays Averages conceal inefficiency. Elite transportation strategists analyze CPM: By lane By customer By driver By trailer type By terminal By season That level of visibility separates surviving fleets from elite fleets. Final Thought Transportation cost per mile is not just an accounting metric. It is a strategic intelligence system. The fleets that dominate the future of transportation will not simply move more freight — they will understand their cost structure with greater precision than their competitors. In trucking, pennies per mile decide: profitability, expansion, acquisitions, bankruptcies, and survival. And most of those pennies are hiding in places the industry still overlooks.
Business meeting in a glass office, with a man speaking to two colleagues across a table.
May 5, 2026
Understand economic vs physical nexus, how each triggers sales tax obligations, and strategies transportation companies can use to manage multi-state compliance.