The Hidden Math of Trucking: Overlooked Cost-Per-Mile Facts Every Transportation Leader Should Know
Share this Article:
In trucking, everyone talks about rates per mile. But surprisingly few transportation professionals truly understand the hidden forces shaping those numbers. Cost per mile (CPM) is more than a spreadsheet formula — it’s the heartbeat of profitability, fleet survival, driver retention, and long-term strategy.
The most successful transportation companies are not always the ones hauling the most freight. Often, they are simply the ones that understand their cost structure better than everyone else.
Here are some of the most overlooked — and surprisingly fascinating — facts about transportation cost per mile.
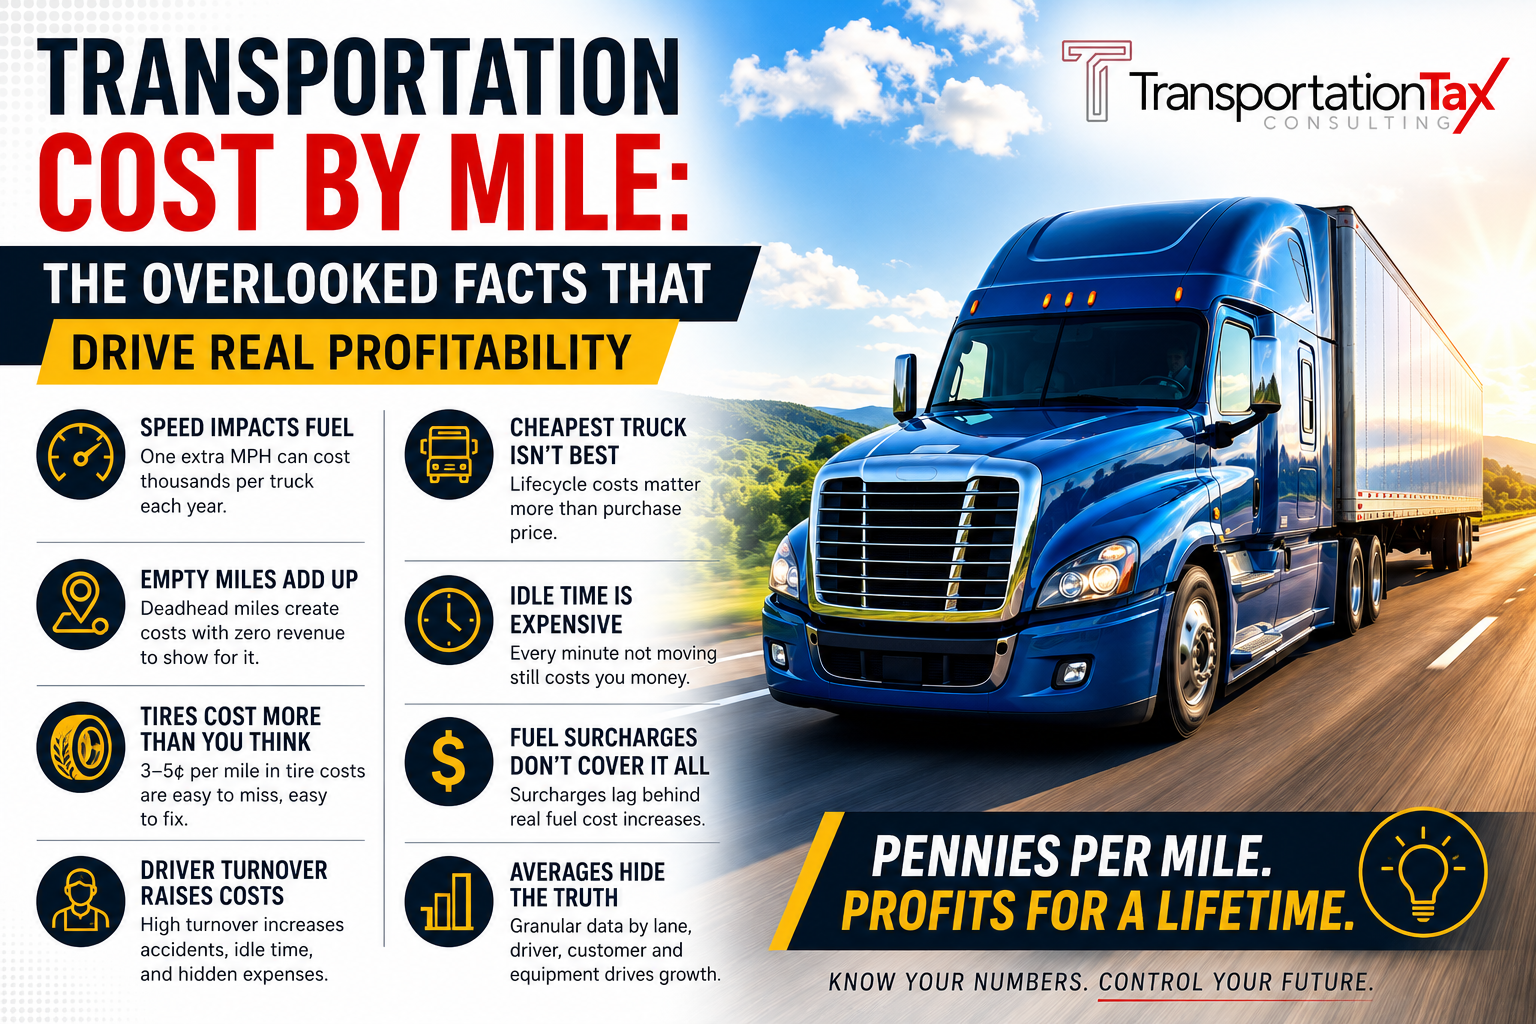
1. One Extra MPH Can Cost Thousands Per Truck Per Year
Most drivers and managers underestimate how dramatically speed impacts fuel economy.
A truck running 70 MPH instead of 65 MPH may only arrive minutes earlier, but fuel efficiency can drop by 0.5 to 1 MPG depending on terrain and equipment.
For a truck running 120,000 miles annually:
- A 1 MPG loss can increase fuel cost by over $8,000 annually per truck
- Across a 100-truck fleet, that can exceed $800,000 yearly
The shocking part? Many fleets focus harder on rate negotiation than speed management, even though speed discipline can create larger margin improvements.
2. Empty Miles Hurt More Than Most Fleets Realize
Deadhead miles are often treated as “part of trucking,” but many strategic planners fail to measure their true impact.
An empty mile still creates:
- Fuel expense
- Tire wear
- Maintenance
- Driver wages
- Depreciation
- Insurance exposure
A truck with a $2.00 loaded CPM may actually require $2.45+ revenue CPM when deadhead is included.
The industry’s biggest hidden leak is not fuel. It’s unproductive miles.
3. Tires Cost More Per Mile Than Many Office Departments
A typical long-haul tractor-trailer can burn through:
- 18 tires
- Multiple replacements yearly
- Thousands in alignment and wear-related issues
Tires alone often account for:
- 3–5 cents per mile
That sounds small until you realize:
- 5 cents × 120,000 miles = $6,000 annually per truck
Poor inflation management can reduce tire life by 20% or more.
Many fleets obsess over diesel prices while ignoring one of their most controllable expenses sitting literally on the ground.
4. Driver Turnover Quietly Raises Cost Per Mile Everywhere
Most people think turnover only affects recruiting costs.
In reality, turnover raises:
- Accident frequency
- Idle time
- Fuel usage
- Maintenance issues
- Insurance claims
- Late deliveries
- Customer churn
A new driver often operates less efficiently than an experienced one familiar with routes, customers, and company procedures.
Some analysts estimate high-turnover fleets unknowingly add:
- 10–20 cents per mile in indirect operational costs
That can erase profitability faster than a soft freight market.
5. The Cheapest Truck Is Not Always the Most Profitable Truck
Many fleets buy equipment based on purchase price instead of lifecycle CPM.
A cheaper truck may:
- Break down more frequently
- Lose fuel efficiency sooner
- Create higher downtime costs
- Have lower resale value
An expensive truck with better fuel economy and uptime may actually produce a lower total CPM over five years.
Strategic fleets calculate:
- Total operating cost
- Residual value
- Maintenance curves
- Downtime probability
Not just monthly payments.
6. Idle Time Is One of the Industry’s Most Expensive Invisible Costs
A truck parked at a dock still burns money.
Even when wheels are not turning:
- Insurance continues
- Driver hours are consumed
- Equipment depreciates
- Financing accrues
- Opportunity cost increases
Some studies estimate detention-related inefficiencies can cost fleets:
- Tens of thousands annually per truck
The most profitable fleets are often not the fastest fleets —
they are the fleets with the least wasted time.
7. Fuel Surcharges Rarely Cover Actual Fuel Costs Perfectly
Many shippers assume fuel surcharges completely offset fuel volatility.
They usually do not.
Why?
Because surcharge formulas often:
- Lag market changes
- Ignore idle fuel burn
- Exclude reefer fuel
- Fail to account for out-of-route miles
- Use outdated baseline assumptions
When diesel spikes quickly, carriers often absorb major temporary losses before surcharge programs catch up.
8. Maintenance Costs Rise Exponentially — Not Gradually
A common misconception is that maintenance increases steadily over time.
In reality, maintenance costs often rise like a curve.
After certain mileage thresholds:
- Repairs become more frequent
- Downtime accelerates
- Parts failures multiply
That is why some fleets trade equipment aggressively while others run equipment longer based on maintenance analytics.
The smartest fleets know exactly when each truck stops being profitable.
9. Cost Per Mile Changes by Freight Type More Than Most Think
Two trucks may drive identical routes but produce completely different CPMs depending on freight.
Examples:
- Refrigerated freight increases fuel burn
- Heavy haul accelerates tire wear
- Hazmat increases insurance exposure
- Multi-stop freight destroys productivity
- Urban deliveries increase braking and idle time
Many transportation professionals benchmark CPM too broadly without segmenting operations correctly.
10. The Most Dangerous Number in Trucking Is “Average CPM”
Average CPM hides operational truth.
One lane may be highly profitable while another silently destroys margins.
One driver may average:
- 7.8 MPG
Another:
- 5.9 MPG
One customer may create:
- 30-minute turns
Another:
- 4-hour detention delays
Averages conceal inefficiency.
Elite transportation strategists analyze CPM:
- By lane
- By customer
- By driver
- By trailer type
- By terminal
- By season
That level of visibility separates surviving fleets from elite fleets.
Final Thought
Transportation cost per mile is not just an accounting metric. It is a strategic intelligence system.
The fleets that dominate the future of transportation will not simply move more freight —
they will understand their cost structure with greater precision than their competitors.
In trucking, pennies per mile decide:
- profitability,
- expansion,
- acquisitions,
- bankruptcies,
- and survival.
And most of those pennies are hiding in places the industry still overlooks.
Share with Us: