Every Mile Has a Price: The True Cost of Moving Freight in North America
Share this Article:
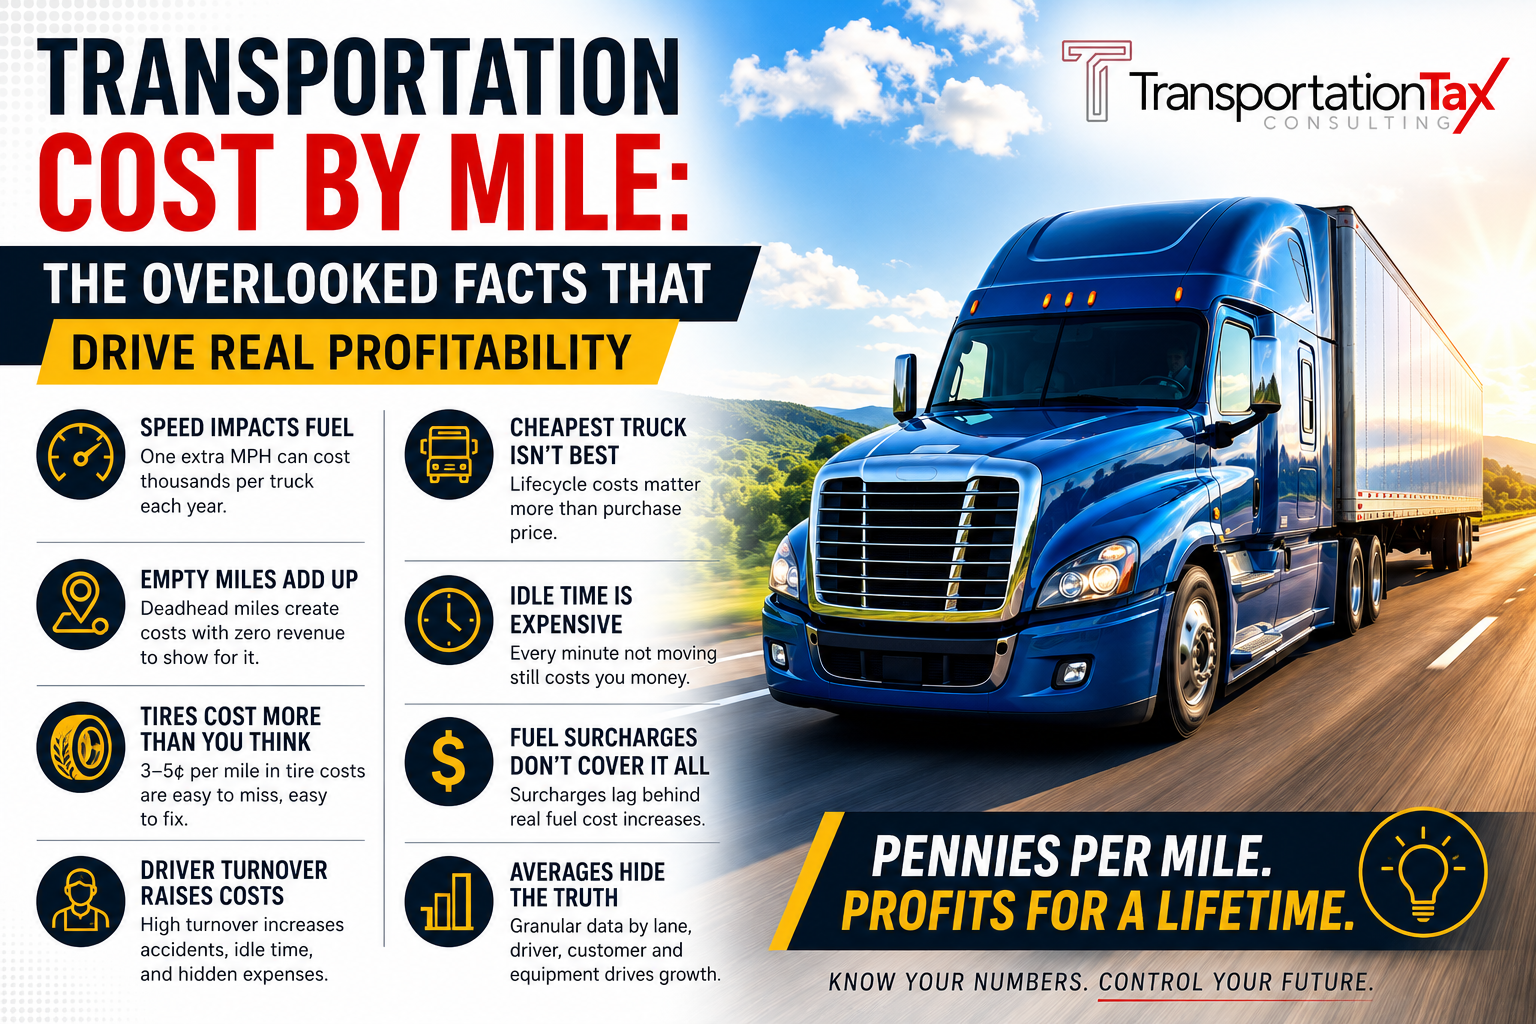
The cost per mile to move freight one mile is one of the most important metrics in the trucking industry. It represents the total operational expense required for a truck to transport freight over a single mile. For carriers, brokers, shippers, and investors, cost per mile serves as a foundational indicator of profitability, operational efficiency, and industry health.
While the concept may sound straightforward, the calculation and interpretation of cost per mile are far more complex. A variety of inputs—including fuel prices, driver wages, insurance, maintenance, equipment costs, and regulatory compliance—combine to determine what it truly costs to move freight down the highway.
Understanding this metric is essential not only for trucking companies seeking to remain profitable, but also for policymakers, economists, and supply chain professionals trying to understand the real cost of transporting goods across North America.
What Is Transportation Cost Per Mile?
Transportation cost per mile measures the average operating cost required for a truck to travel one mile while moving freight. It includes both fixed and variable expenses associated with operating a commercial motor vehicle.
In simple terms:
Cost Per Mile = Total Operating Costs ÷ Total Miles Driven
However, the real-world application requires a more nuanced breakdown because many trucking costs are not strictly tied to miles driven. Some expenses remain constant regardless of mileage, while others fluctuate based on usage.
For this reason, cost per mile is typically derived by allocating all expenses across the total miles traveled during a defined period—often annually.
Major Components of Cost Per Mile
A trucking company’s cost per mile is determined by several key expense categories. While each fleet may have slightly different numbers depending on operating model, equipment type, and freight mix, the fundamental cost drivers remain largely the same across the industry.
1. Fuel
Fuel is usually the largest variable cost in trucking operations. Diesel prices fluctuate based on global oil markets, refining capacity, geopolitical events, and regional supply conditions.
Fuel costs are typically calculated using three inputs:
- Average price per gallon of diesel
- Truck fuel efficiency (miles per gallon)
- Total miles driven
For example:
If diesel costs $4.00 per gallon and a truck averages 7 miles per gallon, the fuel cost per mile is approximately:
$0.57 per mile
Fuel can represent anywhere from 20% to 35% of total operating costs depending on market conditions.
2. Driver Wages and Benefits
Driver compensation is another significant cost component. The industry continues to face driver shortages and wage pressures, which have steadily increased labor costs.
Driver costs typically include:
- Base pay (per mile or percentage of revenue)
- Bonuses
- Benefits
- Payroll taxes
- Recruiting and training expenses
Driver compensation can represent 25% to 40% of total trucking operating costs.
When calculated per mile, driver wages commonly range from $0.60 to $0.80 per mile, depending on experience, freight type, and operating model.
3. Equipment Costs
Trucks and trailers represent major capital investments for carriers. Equipment costs include:
- Truck purchase or lease payments
- Trailer costs
- Depreciation
- Interest expenses
- Licensing and registration
Heavy-duty trucks often cost $150,000 to $200,000 or more, and trailers can add another $40,000 to $80,000 depending on type.
Spread across the typical operational life of the equipment, equipment costs can range from $0.25 to $0.45 per mile.
4. Maintenance and Repairs
Commercial trucks operate in demanding environments and require regular maintenance to remain safe and compliant. Maintenance expenses include:
- Preventive maintenance
- Tires
- Oil changes
- Brake replacement
- Unexpected mechanical repairs
Maintenance costs generally average $0.15 to $0.25 per mile, though this number can increase significantly as equipment ages.
Tires alone may represent $0.05 to $0.08 per mile.
5. Insurance
Insurance is one of the fastest-growing costs in the trucking industry. Rising accident litigation, nuclear verdicts, and insurance market tightening have pushed premiums higher across the sector.
Typical insurance categories include:
- Primary liability insurance
- Cargo insurance
- Physical damage coverage
- Workers compensation
Insurance expenses can range from $0.15 to $0.30 per mile, depending on fleet safety history and coverage levels.
6. Permits, Tolls, and Compliance
Operating across multiple jurisdictions requires carriers to comply with a wide range of regulatory obligations. These include:
- International Fuel Tax Agreement (IFTA) reporting
- International Registration Plan (IRP) fees
- Highway use taxes
- State permits
- Tolls
Compliance costs also include administrative time and software used to manage reporting.
Combined, these expenses typically add $0.05 to $0.12 per mile.
7. Overhead and Administrative Expenses
Beyond direct operating costs, carriers must also manage overhead expenses necessary to run the business. These may include:
- Office staff
- Dispatch and logistics coordination
- Technology platforms
- Accounting and compliance
- Rent and utilities
- Sales and marketing
Overhead costs generally add another $0.10 to $0.20 per mile.
Estimated Average Cost Per Mile
When all components are combined, the average cost to operate a heavy-duty truck in the United States typically falls within the following range:
Cost Category Typical Cost Per Mile
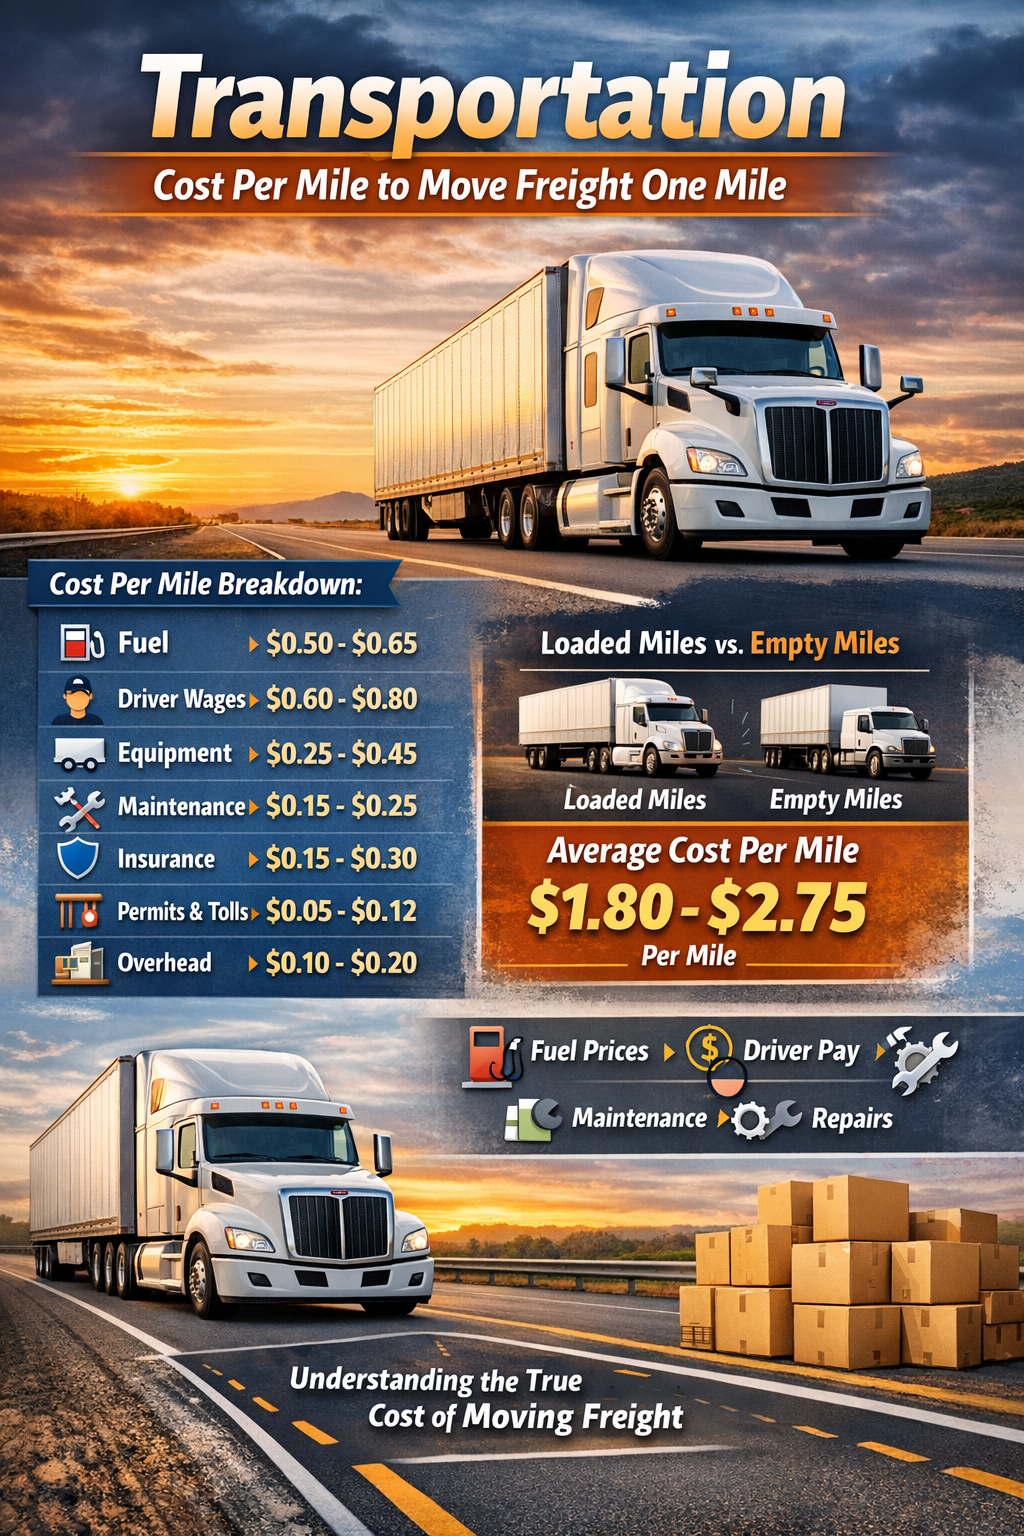
Fuel $0.50 – $0.65
Driver Wages $0.60 – $0.80
Equipment $0.25 – $0.45
Maintenance $0.15 – $0.25
Insurance $0.15 – $0.30
Permits & Compliance $0.05 – $0.12
Overhead $0.10 – $0.20
Total Estimated Cost Per Mile: $1.80 to $2.75 per mile
These numbers can vary significantly depending on fuel prices, fleet efficiency, freight lanes, and economic conditions.
Loaded Miles vs Total Miles
One important nuance in calculating transportation cost per mile is the distinction between loaded miles and total miles driven.
- Loaded miles refer to miles traveled while carrying freight.
- Empty miles (or deadhead miles) occur when a truck moves without cargo.
Since operating costs continue even when the truck is empty, the true cost per mile must consider all miles driven, not just revenue-generating miles.
For example:
A truck may travel 120,000 miles annually, but only 100,000 miles may be loaded.
If total annual operating costs equal $240,000, then:
- Cost per total mile = $2.00
- Cost per loaded mile = $2.40
This difference significantly impacts pricing strategies and profitability.
Freight Rates vs Cost Per Mile
Carriers must charge freight rates that exceed their cost per mile in order to remain profitable.
If a carrier’s cost per mile is $2.20, and freight rates average $2.50 per mile, the operating margin is:
$0.30 per mile
However, when freight rates fall below cost per mile—as often occurs during freight recessions—carriers begin losing money on every mile driven.
This dynamic has historically triggered waves of trucking bankruptcies during downturns in the freight cycle.
Factors That Influence Cost Per Mile
Several macroeconomic and operational factors influence trucking cost per mile.
Fuel Price Volatility
Fuel price swings can quickly raise or lower operating costs. Many carriers rely on fuel surcharges to offset diesel price changes.
Equipment Utilization
Higher annual mileage spreads fixed costs across more miles, lowering cost per mile.
Fleet Age
Older equipment generally requires more maintenance and repairs.
Freight Density
Operating in regions with strong freight demand reduces empty miles and improves cost efficiency.
Insurance Market Conditions
Insurance premiums have risen significantly in recent years, adding pressure to carrier operating costs.
Technology and Cost Efficiency
Modern trucking companies increasingly rely on technology to reduce cost per mile and improve operational efficiency.
Examples include:
- Telematics systems that monitor fuel efficiency
- Route optimization software
- Predictive maintenance systems
- Electronic logging devices (ELDs)
- Automated dispatch platforms
By improving fuel efficiency, reducing idle time, and minimizing empty miles, these tools can significantly lower operating costs.
The Role of Cost Per Mile in Industry Cycles
Cost per mile also plays a key role in understanding broader trucking industry cycles.
When freight demand is strong, rates rise above operating costs, leading to:
- Fleet expansion
- Increased truck orders
- New carriers entering the market
Eventually, capacity oversupply drives rates downward, compressing margins and pushing weaker carriers out of the market.
These cycles have repeated throughout the history of the trucking industry.
Why Cost Per Mile Matters to the Supply Chain
While cost per mile is critical for trucking companies, its impact extends far beyond the industry itself.
Transportation costs influence:
- Retail prices
- Manufacturing supply chains
- Inventory strategies
- Regional economic development
- Inflation trends
Since trucking moves more than 70% of domestic freight in the United States, even small increases in transportation cost per mile can ripple throughout the entire economy.
Conclusion
The transportation cost per mile to move freight one mile represents one of the most essential metrics in the trucking industry. It reflects the combined impact of fuel prices, driver wages, equipment costs, insurance, maintenance, regulatory compliance, and administrative expenses.
In today’s market, the average cost to operate a heavy-duty truck typically ranges between $1.80 and $2.75 per mile, though actual numbers vary depending on operating conditions and fleet efficiency.
For carriers, understanding and managing cost per mile is fundamental to maintaining profitability. For shippers and supply chain professionals, it provides critical insight into freight pricing and logistics planning.
As the transportation industry continues to evolve through technology, regulatory change, and economic cycles, cost per mile will remain a central benchmark for evaluating the true cost of moving goods across the highway.
Ultimately, every mile matters—and understanding its cost is essential to keeping freight moving efficiently across North America.
Share with Us: