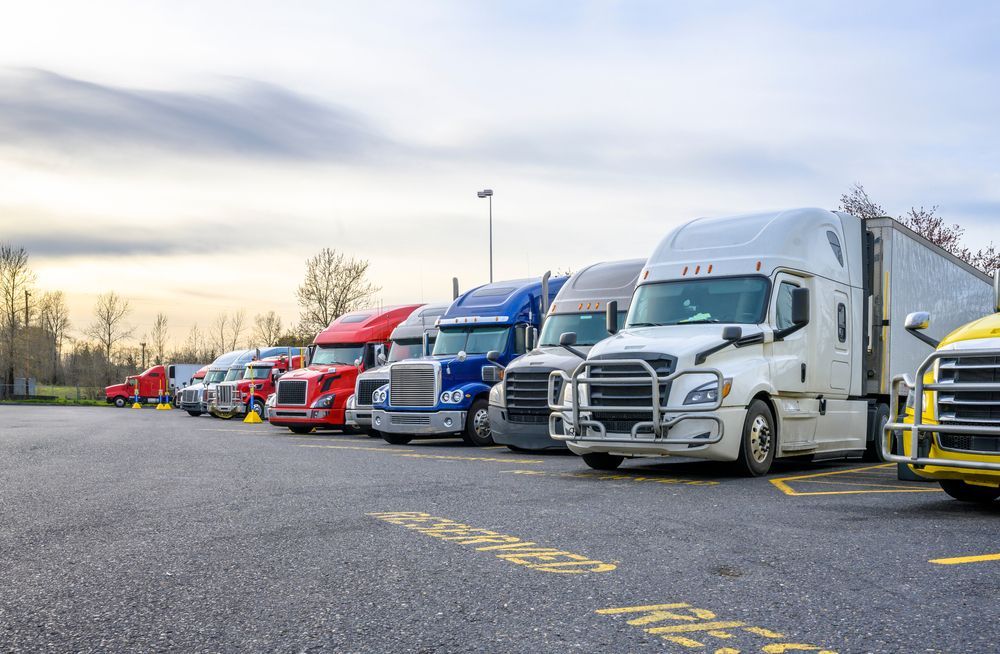
Mega Rail Acquisition Will Impact Trucking Freight Volumes

Share this Article:
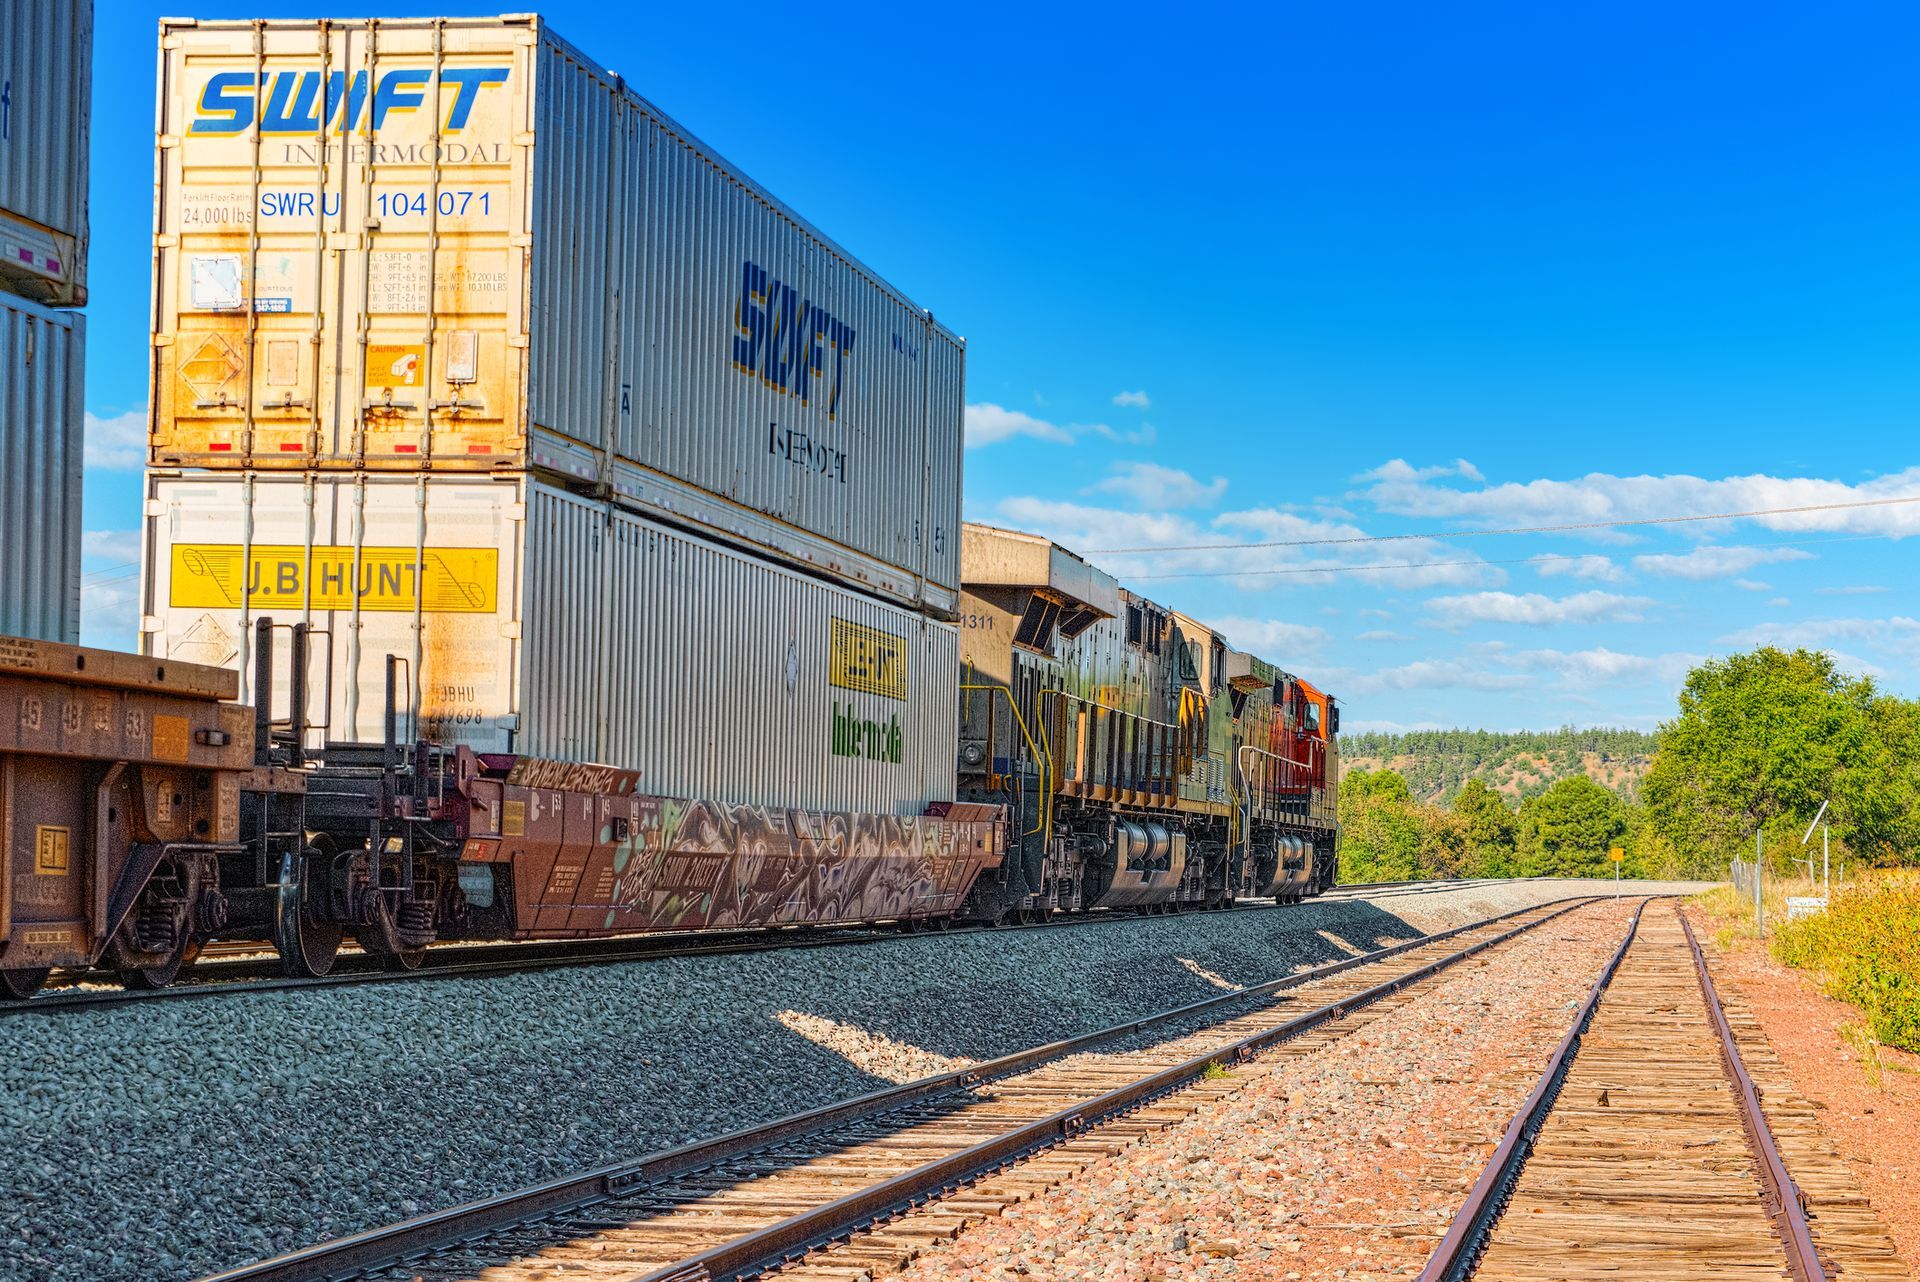
The U.S. transportation industry is bracing for a transformational shift as Union Pacific (UP) moves to acquire Norfolk Southern (NS) in one of the largest rail mergers in decades. The proposed acquisition would create a coast-to-coast rail giant connecting the West Coast, Midwest, and Eastern Seaboard—effectively redrawing the competitive map of North American freight.


While the deal is still pending regulatory approval, its implications are already rippling through the logistics sector. Chief among them is the expected impact on the trucking industry, especially in areas such as:

  • Freight volumes (in trucking tons)
  • Cost per mile for freight movement
  • Trucking profit margins
  • Trucking bankruptcies
  • Consolidation and mergers across transportation sectors

This article breaks down each of these impacts in detail and explains how industry players should prepare for the coming realignment.


Rail and Trucking: Interlinked but Competitive

For decades, rail and trucking have operated in a complementary yet competitive fashion. Rail moves about 28% of U.S. freight ton-miles, while trucking dominates the short-haul and last-mile segments with about 72% of freight by tonnage. The rise of intermodal freight, where goods are shipped via multiple modes (usually rail + truck), has intensified this relationship.


The Union Pacific–Norfolk Southern merger would create a truly transcontinental rail system, enabling uninterrupted rail service from Los Angeles to Atlanta, and from Seattle to the ports of Virginia. This significantly enhances rail's competitive position over long-haul trucking, especially for shippers looking to cut costs.


How the Merger Will Impact Trucking Freight Volumes


Shift to Intermodal Rail

One of the first and most visible consequences of the acquisition will be a significant shift of freight from trucks to rail, especially intermodal shipments.


The newly combined rail network will offer:

  • More direct intermodal corridors
  • Lower transit times between major ports and inland hubs
  • Economies of scale that reduce the cost per container


Major corridors likely to see freight diversion from truck to rail include:

  • Los Angeles ↔ Atlanta
  • Dallas ↔ Charlotte
  • Chicago ↔ Norfolk
  • Kansas City ↔ Savannah


According to industry estimates, this shift could pull as much as 5–8% of truckload freight volume off the highways over the next three to five years.


Estimated Trucking Tons Lost

The American Trucking Associations (ATA) reports that the U.S. trucking industry hauls about 11.5 billion tons of freight annually. If 4–5% of that moves to rail, the trucking industry could lose over 400 million tons per year in long-haul freight—a staggering blow concentrated on large national carriers and long-haul routes.


Short-haul and regional carriers will be less affected, but OTR (over-the-road) carriers will bear the brunt.


Cost Per Mile: Downward Pressure


How Rail Lowers Freight Costs

Railroads move freight more efficiently over long distances. According to the Association of American Railroads (AAR), trains can move a ton of freight over 470 miles on a single gallon of fuel. This efficiency translates to lower rates for shippers.


Whereas long-haul trucking averages $2.05 per mile, intermodal rail can offer rates closer to $0.85–$1.15 per mile, especially on lanes over 1,000 miles.


The combined UP-NS network will allow for more direct east-west intermodal services, cutting out handoffs and inefficiencies. As a result:

  • Rail rates may drop 5–10% in targeted lanes
  • Trucking rates will feel downward pressure, especially in contract negotiations
  • Brokers and shippers will have more leverage when choosing modes


Margin Squeeze on Trucking

At the same time, trucking costs continue to rise due to:

  • Fuel price volatility
  • Equipment and insurance inflation
  • Driver shortages and wage hikes
  • Regulatory compliance costs


This divergence between rising costs and declining pricing power could compress profit margins industry-wide—especially for carriers unable to pivot into regional, niche, or intermodal-support roles.


Impact on Trucking Profits


Profitability Trends

Public carriers like Knight-Swift and J.B. Hunt have already flagged lower operating ratios in recent quarters due to soft volumes and competitive pressure. This trend will likely deepen post-merger.


Mid-size carriers operating in high-volume corridors—particularly from the Midwest to the Southeast—will face:

  • Reduced revenue per truck
  • Higher empty mile ratios
  • Tougher rate negotiations


Forecasts suggest that average net profit margins in truckload freight could fall from 6.5% in 2023 to under 4% by 2026 for those heavily exposed to long-haul lanes now being targeted by rail.


Winners and Losers


Winners:

  • Trucking companies with intermodal partnerships
  • Regional LTL carriers
  • Drayage and first-mile/last-mile operators


Losers:

  • Long-haul OTR operators
  • Non-asset 3PLs with limited modal flexibility
  • Carriers with high fixed costs and low rate flexibility


A Surge in Trucking Bankruptcies?


Current Strains

Even before this rail acquisition, trucking bankruptcies had been on the rise. According to Broughton Capital and FreightWaves, over 1,600 carriers exited the market in 2024, largely due to:

  • Spot rate softness
  • Fuel cost volatility
  • Increasing debt loads from pandemic-era fleet expansions


Merger-Related Fallout

As the merged UP-NS entity pulls freight volume and pricing power away from trucks, expect a second wave of bankruptcies—especially among:

  • Small carriers dependent on spot freight
  • Mid-size fleets locked into uncompetitive contract terms
  • Operators with high leverage or limited cash flow


Estimates suggest 2,000–2,500 additional carrier exits by 2027. The fallout will hit some regions harder than others—particularly the Southeast, Ohio Valley, and Southern California.


Transportation Mergers: Domino Effect


Trucking Consolidation Will Accelerate

To survive and compete, many trucking firms will pursue:

  • Strategic M&A to gain scale and diversify offerings
  • Tech integration for load optimization and routing
  • Modal diversification into LTL, final mile, or warehousing


Recent examples:

  • Knight-Swift acquiring U.S. Xpress
  • TFI International expanding its LTL and dedicated divisions
  • Werner and ArcBest investing heavily in 3PL technology


Expect more roll-ups of regional players and increased activity in distressed asset sales.


Rail-Broker Collaboration Will Grow

This merger may also encourage tighter integration between rail carriers and logistics providers. Look for:

  • Rail–broker joint ventures
  • Co-branded intermodal offerings
  • Tech-driven visibility platforms to support rail-truck integration


Truckers who embrace these changes and reposition as logistics partners—not just asset providers—stand to benefit.


What This Means for Shippers, Brokers, and Drivers

Shippers

Pros:

  • Lower rates on long-haul freight
  • Better intermodal coverage from coast to coast
  • More carrier options in integrated supply chains


Cons:

  • Learning curve in managing intermodal freight
  • Risk of delays during rail network integration
  • Less redundancy in modes if trucking capacity contracts


Freight Brokers

Pros:

  • Opportunity to offer modal flexibility and optimization
  • Chance to grow intermodal brokerage offerings


Cons:

  • Margin pressure on traditional TL brokerage
  • Need to invest in rail rate knowledge and capacity access


Truck Drivers

Long-haul drivers will see the biggest impact:

  • Potential for reduced miles and earnings
  • Consolidation of routes and terminals


But growth may emerge in:

  • Regional driving
  • Port and terminal drayage
  • Dedicated, private fleet operations


Retraining and geographic flexibility will be key to long-term stability.


Regulatory and Infrastructure Outlook


Surface Transportation Board Scrutiny

The STB is reviewing the UP–NS deal carefully, focusing on:

  • Market power and competition
  • Service quality during integration
  • Access for short-line railroads


Expect some conditions imposed—like terminal access provisions or service guarantees—but the merger is likely to proceed, given the precedent set by recent CP–KC Southern consolidation.


Infrastructure Investment Boom

Post-merger, expect:

  • New intermodal terminals
  • Upgraded rail yards and drayage infrastructure
  • Greater emphasis on digital platforms for shipment visibility


Trucking companies with the capital to co-invest or co-locate near these hubs will benefit the most.


Conclusion: Disruption Is Opportunity for the Prepared

The Union Pacific–Norfolk Southern acquisition represents more than a business deal—it’s a strategic inflection point for the transportation industry.


While trucking volumes, profit margins, and company count may shrink in the near term, those who adapt will find new niches, new partners, and new ways to serve a rapidly evolving freight economy.

The winners will be:

  • Intermodal-savvy
  • Tech-forward
  • Financially disciplined
  • Strategically agile


Those who cling to the status quo? They may find themselves outmaneuvered—not just by railroads, but by the freight ecosystem of tomorrow.


Share with Us:

By Matthew Bowles June 8, 2026
A restructuring project lives or dies on a single question: does the new structure actually lower your tax — in every state you touch — without creating new exposure somewhere else? Answering that takes two things most firms don't pair together: deep transportation tax expertise and a disciplined project method. Transportation Tax Consulting brings both. We build the project around your footprint, not a template We start by mapping how your business is taxed today — federally and across all 51 jurisdictions where your equipment, mileage, and people create obligations. That diagnostic is where the real opportunities surface, and it's the step generalist firms skip when they reach for an off-the-shelf structure that wasn't designed for a motor carrier. We pull the levers that are specific to transportation The savings in a transportation restructure come from levers other advisors don't see: separating operating, asset-holding, and equipment-leasing entities; situating them where they reduce sales and use tax, property tax, and income and franchise tax; structuring intercompany leasing; and accounting for mileage-based apportionment, rolling stock exemptions, nexus, and the interplay of FET, IFTA, and IRP. We design the structure around how transportation is actually taxed, not how a typical business is. We model the savings before you spend a dollar restructuring Before you commit to anything, we quantify the projected effective-rate reduction and stress-test it against alternative structures. You see the numbers — state by state, scenario by scenario — including any new apportionment or nexus exposure a given option would create. The decision to proceed is driven by a model, not a hunch, and you know what the project is worth before you fund it. We quarterback execution alongside your counsel We lead the tax design and run the project end to end. The legal mechanics — forming entities and drafting agreements — sit with your attorneys, and we work in lockstep with them so the executed structure delivers the tax result it was engineered to produce. You get a single team driving the engagement, not a pile of disconnected advice. We make the result defensible and audit-ready Minimizing tax only matters if the position holds up. Every element of the structure is supported by primary-source analysis and contemporaneous documentation, built to withstand state examination and to answer, clearly, how and why the structure was put in place. We stay with you after close A structure is only as good as the compliance that follows it. We carry the project through to ongoing multistate filing and monitoring — and because we're already inside your tax data, we continue surfacing recovery opportunities and structural refinements long after the restructure is complete. The result: a measurably lower multistate tax burden, delivered by a structure that was diagnosed, modeled, executed, and defended by a team that does nothing but transportation tax.
By Matthew Bowles May 14, 2026
In trucking, everyone talks about rates per mile. But surprisingly few transportation professionals truly understand the hidden forces shaping those numbers. Cost per mile (CPM) is more than a spreadsheet formula — it’s the heartbeat of profitability, fleet survival, driver retention, and long-term strategy. The most successful transportation companies are not always the ones hauling the most freight. Often, they are simply the ones that understand their cost structure better than everyone else. Here are some of the most overlooked — and surprisingly fascinating — facts about transportation cost per mile. 1. One Extra MPH Can Cost Thousands Per Truck Per Year Most drivers and managers underestimate how dramatically speed impacts fuel economy. A truck running 70 MPH instead of 65 MPH may only arrive minutes earlier, but fuel efficiency can drop by 0.5 to 1 MPG depending on terrain and equipment. For a truck running 120,000 miles annually: A 1 MPG loss can increase fuel cost by over $8,000 annually per truck Across a 100-truck fleet, that can exceed $800,000 yearly The shocking part? Many fleets focus harder on rate negotiation than speed management, even though speed discipline can create larger margin improvements. 2. Empty Miles Hurt More Than Most Fleets Realize Deadhead miles are often treated as “part of trucking,” but many strategic planners fail to measure their true impact. An empty mile still creates: Fuel expense Tire wear Maintenance Driver wages Depreciation Insurance exposure A truck with a $2.00 loaded CPM may actually require $2.45+ revenue CPM when deadhead is included. The industry’s biggest hidden leak is not fuel. It’s unproductive miles. 3. Tires Cost More Per Mile Than Many Office Departments A typical long-haul tractor-trailer can burn through: 18 tires Multiple replacements yearly Thousands in alignment and wear-related issues Tires alone often account for: 3–5 cents per mile That sounds small until you realize: 5 cents × 120,000 miles = $6,000 annually per truck Poor inflation management can reduce tire life by 20% or more. Many fleets obsess over diesel prices while ignoring one of their most controllable expenses sitting literally on the ground. 4. Driver Turnover Quietly Raises Cost Per Mile Everywhere Most people think turnover only affects recruiting costs. In reality, turnover raises: Accident frequency Idle time Fuel usage Maintenance issues Insurance claims Late deliveries Customer churn A new driver often operates less efficiently than an experienced one familiar with routes, customers, and company procedures. Some analysts estimate high-turnover fleets unknowingly add: 10–20 cents per mile in indirect operational costs That can erase profitability faster than a soft freight market. 5. The Cheapest Truck Is Not Always the Most Profitable Truck Many fleets buy equipment based on purchase price instead of lifecycle CPM. A cheaper truck may: Break down more frequently Lose fuel efficiency sooner Create higher downtime costs Have lower resale value An expensive truck with better fuel economy and uptime may actually produce a lower total CPM over five years. Strategic fleets calculate: Total operating cost Residual value Maintenance curves Downtime probability Not just monthly payments. 6. Idle Time Is One of the Industry’s Most Expensive Invisible Costs A truck parked at a dock still burns money. Even when wheels are not turning: Insurance continues Driver hours are consumed Equipment depreciates Financing accrues Opportunity cost increases Some studies estimate detention-related inefficiencies can cost fleets: Tens of thousands annually per truck The most profitable fleets are often not the fastest fleets — they are the fleets with the least wasted time. 7. Fuel Surcharges Rarely Cover Actual Fuel Costs Perfectly Many shippers assume fuel surcharges completely offset fuel volatility. They usually do not. Why? Because surcharge formulas often: Lag market changes Ignore idle fuel burn Exclude reefer fuel Fail to account for out-of-route miles Use outdated baseline assumptions When diesel spikes quickly, carriers often absorb major temporary losses before surcharge programs catch up. 8. Maintenance Costs Rise Exponentially — Not Gradually A common misconception is that maintenance increases steadily over time. In reality, maintenance costs often rise like a curve. After certain mileage thresholds: Repairs become more frequent Downtime accelerates Parts failures multiply That is why some fleets trade equipment aggressively while others run equipment longer based on maintenance analytics. The smartest fleets know exactly when each truck stops being profitable. 9. Cost Per Mile Changes by Freight Type More Than Most Think Two trucks may drive identical routes but produce completely different CPMs depending on freight. Examples: Refrigerated freight increases fuel burn Heavy haul accelerates tire wear Hazmat increases insurance exposure Multi-stop freight destroys productivity Urban deliveries increase braking and idle time Many transportation professionals benchmark CPM too broadly without segmenting operations correctly. 10. The Most Dangerous Number in Trucking Is “Average CPM” Average CPM hides operational truth. One lane may be highly profitable while another silently destroys margins. One driver may average: 7.8 MPG Another: 5.9 MPG One customer may create: 30-minute turns Another: 4-hour detention delays Averages conceal inefficiency. Elite transportation strategists analyze CPM: By lane By customer By driver By trailer type By terminal By season That level of visibility separates surviving fleets from elite fleets. Final Thought Transportation cost per mile is not just an accounting metric. It is a strategic intelligence system. The fleets that dominate the future of transportation will not simply move more freight — they will understand their cost structure with greater precision than their competitors. In trucking, pennies per mile decide: profitability, expansion, acquisitions, bankruptcies, and survival. And most of those pennies are hiding in places the industry still overlooks.
Business meeting in a glass office, with a man speaking to two colleagues across a table.
May 5, 2026
Understand economic vs physical nexus, how each triggers sales tax obligations, and strategies transportation companies can use to manage multi-state compliance.